
Google Analytics 4 provides ample insight into your business without any customization. You can use it right out of the box and get information that will help you make better SEO and PPC decisions.
It comes into its own, however, when you create custom reports and dashboards to fine-tune what you see. Use the guide below to customize your GA4 account.
Getting Up and Running with GA4
Before you begin building custom reports, you need to make sure Google Analytics is installed and working properly on your site. Don’t go through the effort of creating reports that won’t deliver accurate information because there is a problem with your GA4 account or installation.
To help you get on track with GA4, we have already produced several previous articles on the topic. Feel free to explore those listed below –
In addition to these resources, you can also use the information and resources provided directly from Google to iron out any issues you are having in GA4. It’s best to address these upfront rather than accumulating weeks’ or months’ worth of data that are not painting an accurate picture.
Setting the Stage New Custom Report in GA4
The process described in the following sections will guide you through the steps needed to build a new custom free-form report. With a little practice, it’s possible to build countless different types of reports within this interface.
The first step is to access your account and look to the left side of the screen. The panel that pops up will present you with a few options, and you want to select Explore.
From there, a page will appear with a few different options, including starting with a Blank Template. The Blank Template is a good option for those with a lot of experience building reports, but at this point, start with the Free Form Template and then adjust it as needed to reach the desired result.
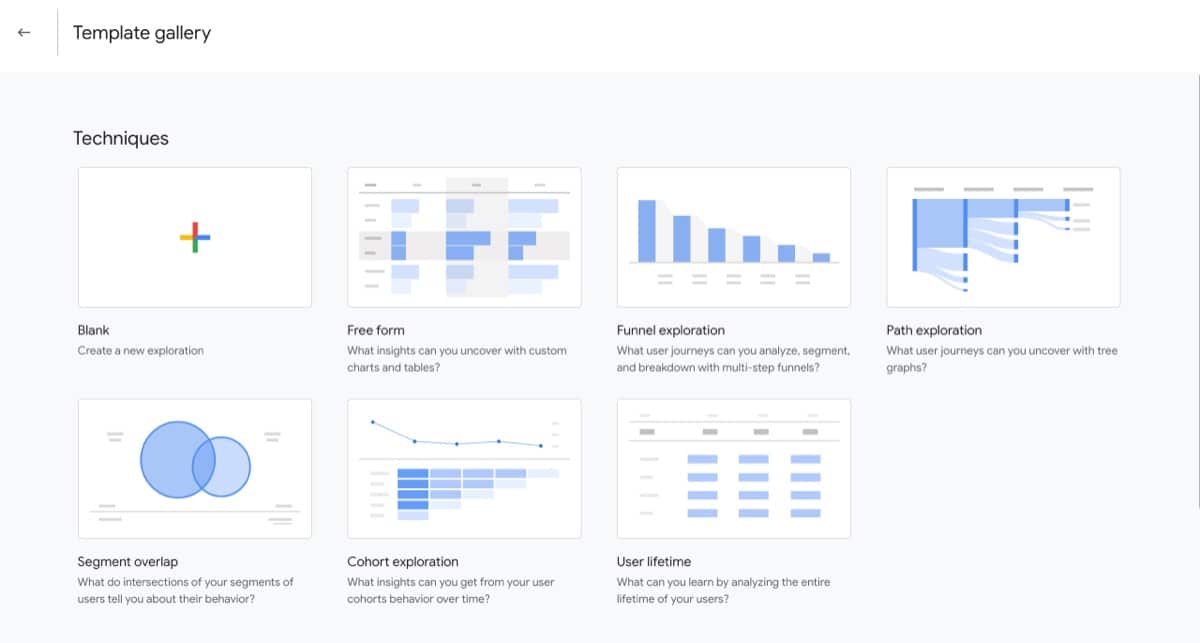
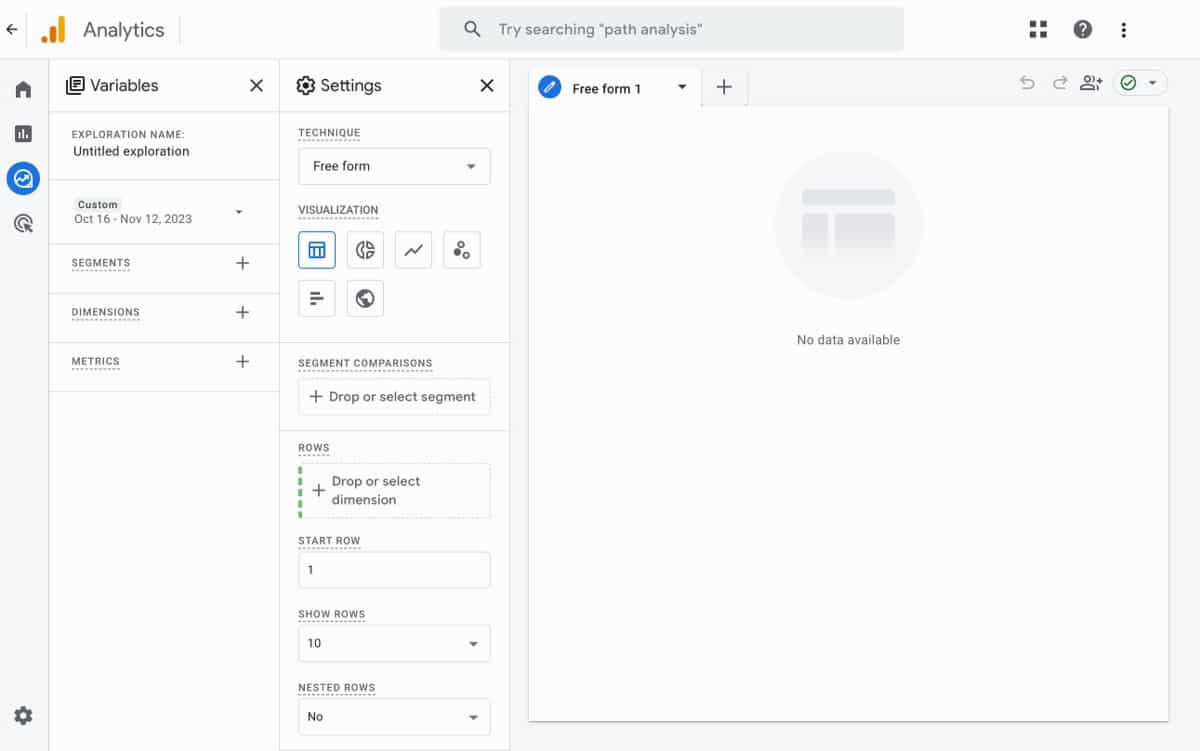
After you choose the Free Form Template, you’ll be taken to a screen where you can start to put this report together. There, you are going to find two columns –
- Variables. This column presents the many options you have for variables that can be added to the report. Once you find the variables you want to use for your custom report, you can simply drag them into the adjacent Tab Settings column to add them to the report. We’ll talk more below about what variables you can use to create informative, detailed reports.
- Tab Settings. The main control interface for how your report is populated and displayed is in the Tab Settings column. You’ll find spots here to drop variables for both rows and columns, and you can select from a few different types of visualizations to show the resulting data in a way that is meaningful and easy to consume. It’s easy to come back and make changes to the visualizations later, so don’t worry too much about which option you pick to start with.
Making Your First Variable Selections
It’s now time to start making choices in the variables tab that will shape the report you are going to create. Starting at the top of the column, the first two choices you encounter are as follows –
- Date range. This might be the easiest step of the whole custom reporting process. All you need to do in this field is determine the range of dates that you would like to include in your data set. It’s common to use the past 30 days as a starting point, but you are free to select whatever makes the most sense for your business.
- Segments. Segmenting your audience is another valuable tool available in GA4 custom reporting. You are free to skip segments in your report and just use all of the data you have collected, but breaking a report down by one or more segments can make it more useful and informative. Options here include choosing a specific country (or state, or city), traffic source (such as paid or organic), or device (desktop, mobile, tablet). Think about what story you want the finished report to tell and then drag the suitable segments over to the Tab Settings column to match your needs.
For your very first custom GA4 report, keep things as open and general as possible. Use a wide date range and either skip the segments entirely or just use one or two to filter out your data a bit. With experience will come confidence, and you can start to dial in these controls more tightly to refine your results and extract valuable insights.
What Dimensions and Metrics Are Available in Google Analytics 4?
Dimensions and metrics are at the heart of all of your custom reports. These are what pull in the data and give you something meaningful to review in the finished product.
First, let’s talk about dimensions. Adding dimensions is another way to effectively filter your data and highlight specific areas that you want to know more about. Some popular dimensions to include in your report are the following –
- Age. The age dimension will break up the data in your report by age buckets of roughly 10 years each. If you want to know how visitors are interacting with your site based on their age so you can fine-tune your marketing efforts, this is a valuable dimension to include in a report.
- Device category. Many businesses make the mistake of designing their website on a desktop and forgetting that most visits come from mobile devices. Is that true for your site, and how are visitors behaving based on what kind of device they are using? The device category dimension will offer insight into these questions.
- Gender. Like age, the gender dimension is a great way to understand the behavior of your visitors so you can tailor your strategies accordingly. If more men are making purchases than women, for example, you might need to adjust your marketing to better cater to the female audience.
Picking the right dimensions is only going to be useful if you have the right metrics to go with them. There are many different metrics included in GA4, including some that you probably associate with being at the heart of website analytics.
- Sessions. Perhaps the core metric that defines what Google Analytics can do for your business is sessions. This is simply a measure of how many times visitors come to your website during a given time frame (such as the last 30 days). Each time a user comes to your site, a new session will be recorded, and the session will be considered complete after 30 minutes of inactivity.
- Views per session. Closely related to the first metric on our list, this one tracks how many different pages are visited during each session. It is calculated simply by dividing the total views on your site by the number of sessions – so, if you have recorded 100 views during a period of time, and had 50 sessions at that same time, you would have a views per session result of 2.
- Bounce rate. Measuring the way your site is received by visitors can be tricky, but bounce rate offers some helpful insight. The bounce rate of your site is the percentage of visitors who leave immediately after they land on one of your pages. If someone visits your site and leaves without taking any type of action, that visit is recorded as a “bounce”. The percentage of users who bounce is represented as your bounce rate.
- New users. Is your traffic coming from people who keep returning to the site again and again, or is it the result of new visitors? The New Users metric is a good way to understand this important point. If you have a large percentage of new users, it’s safe to assume that some of your marketing channels are working effectively.
These four examples are just a small sampling of what is available within the selection of metrics in GA4. Spend some time in the interface getting to know what is offered and you’ll soon develop many different ways to analyze your data.
Quickly Find the Variables You Need
When building your report, whether you are adding dimensions or metrics, you don’t want to spend a lot of time hunting around for what you need. Fortunately, since GA4 is a Google product, you can trust the search function to solve this problem.
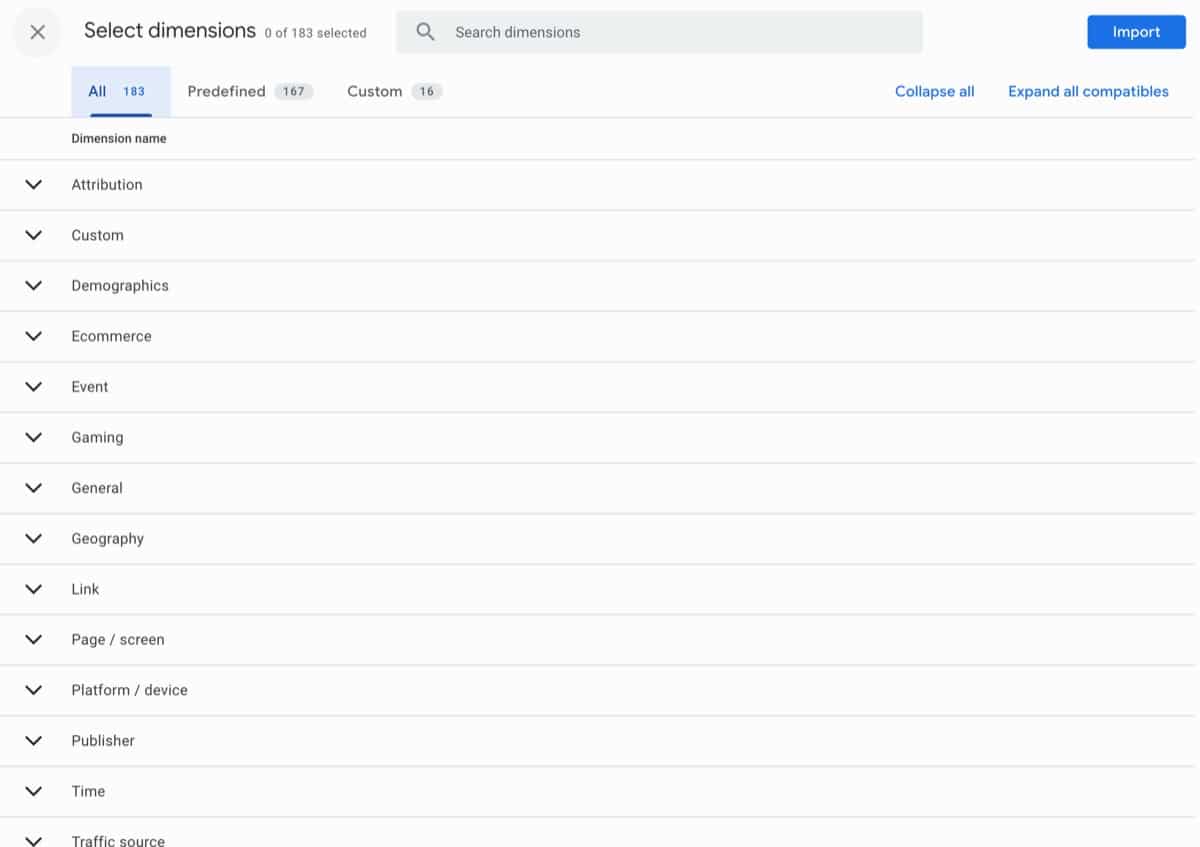
In the Variables column, click the “+” button next to either Dimensions or Metrics, depending on which one you’d like to add. In the panel that pops up, look up to the top and use the search bar to find what you need. Select the variable or variables that you want to bring in, then click or tap the “Import” button in the top right corner to finish the job.
Exploring Custom GA4 Dashboards
Many business owners and managers don’t find the default dashboards in GA4 to be useful for their needs. If you fall into that category, custom dashboards are the way to go.
You don’t need to start from scratch to create something useful, as starting with the default dashboards will give you a head start. Pick a dashboard that is close to what you want to see and then look for the pencil icon in the top right corner – click or tap on that to customize the report you are viewing.
In the menu that appears, you can pick the Add filter button to adjust the data that is being displayed in the dashboard. There is a limit of five filters for each dashboard, but even just applying one or two could make the display far more useful.
If you have already built some Audiences within your GA4 account, customizing dashboards is a great place to put those audiences to use. For instance, an Audience that is defined as visitors who go to at least 10 pages might be informative because those users obviously like what they see. Using that group as a dashboard filter will show you how your most satisfied users are interacting with the site, and you might take knowledge from that to apply to your broader user base.
GA4 is a Powerful Tool
Don’t be afraid of GA4 any longer. With help from this guide and other tools, you can get your arms around this powerful software and have it produce information and insights that drive your digital marketing efforts forward. Good luck!

Related Articles:

The Long Game: Why B2B Content Marketing Pays Off When…
A few months ago, I picked up bread baking. Not as a grand ambition, but as a desire to do more with my hands and…

The Most Valuable Inbound Marketing Content is Already Sitting Inside…
One of the most common challenges organizations face with inbound marketing is consistently generating content ideas. Not because there’s nothing to say, but because everything…

How to Discover and Report AI Traffic to Your Website…
Artificial intelligence is changing how people discover information online. Instead of relying solely on traditional Google searches, users are increasingly turning to AI-powered tools like…


Most Popular Articles

Seeing Favicons in Your Google Search Results? Here’s Why…
Have you noticed anything different in your Google Search results lately? Google added tiny favicon icons to its organic search results in January. It was…

How to Use Email Analytics and Metrics to Measure Success
Email marketing remains one of the most effective digital marketing strategies, but success doesn't come from simply sending messages out into the abyss. To truly…

AI or Agency? The pros and cons of a human touch vs artificial intelligence in web design
Your organization’s website is a critical marketing channel. It’s the first impression many customers have of your business and it plays a vital role in…